> ## Documentation Index
> Fetch the complete documentation index at: https://docs.bigdelta.com/llms.txt
> Use this file to discover all available pages before exploring further.
# Dashboards
> Monitor multiple metrics at once with customizable dashboard layouts
 ## What are dashboards?
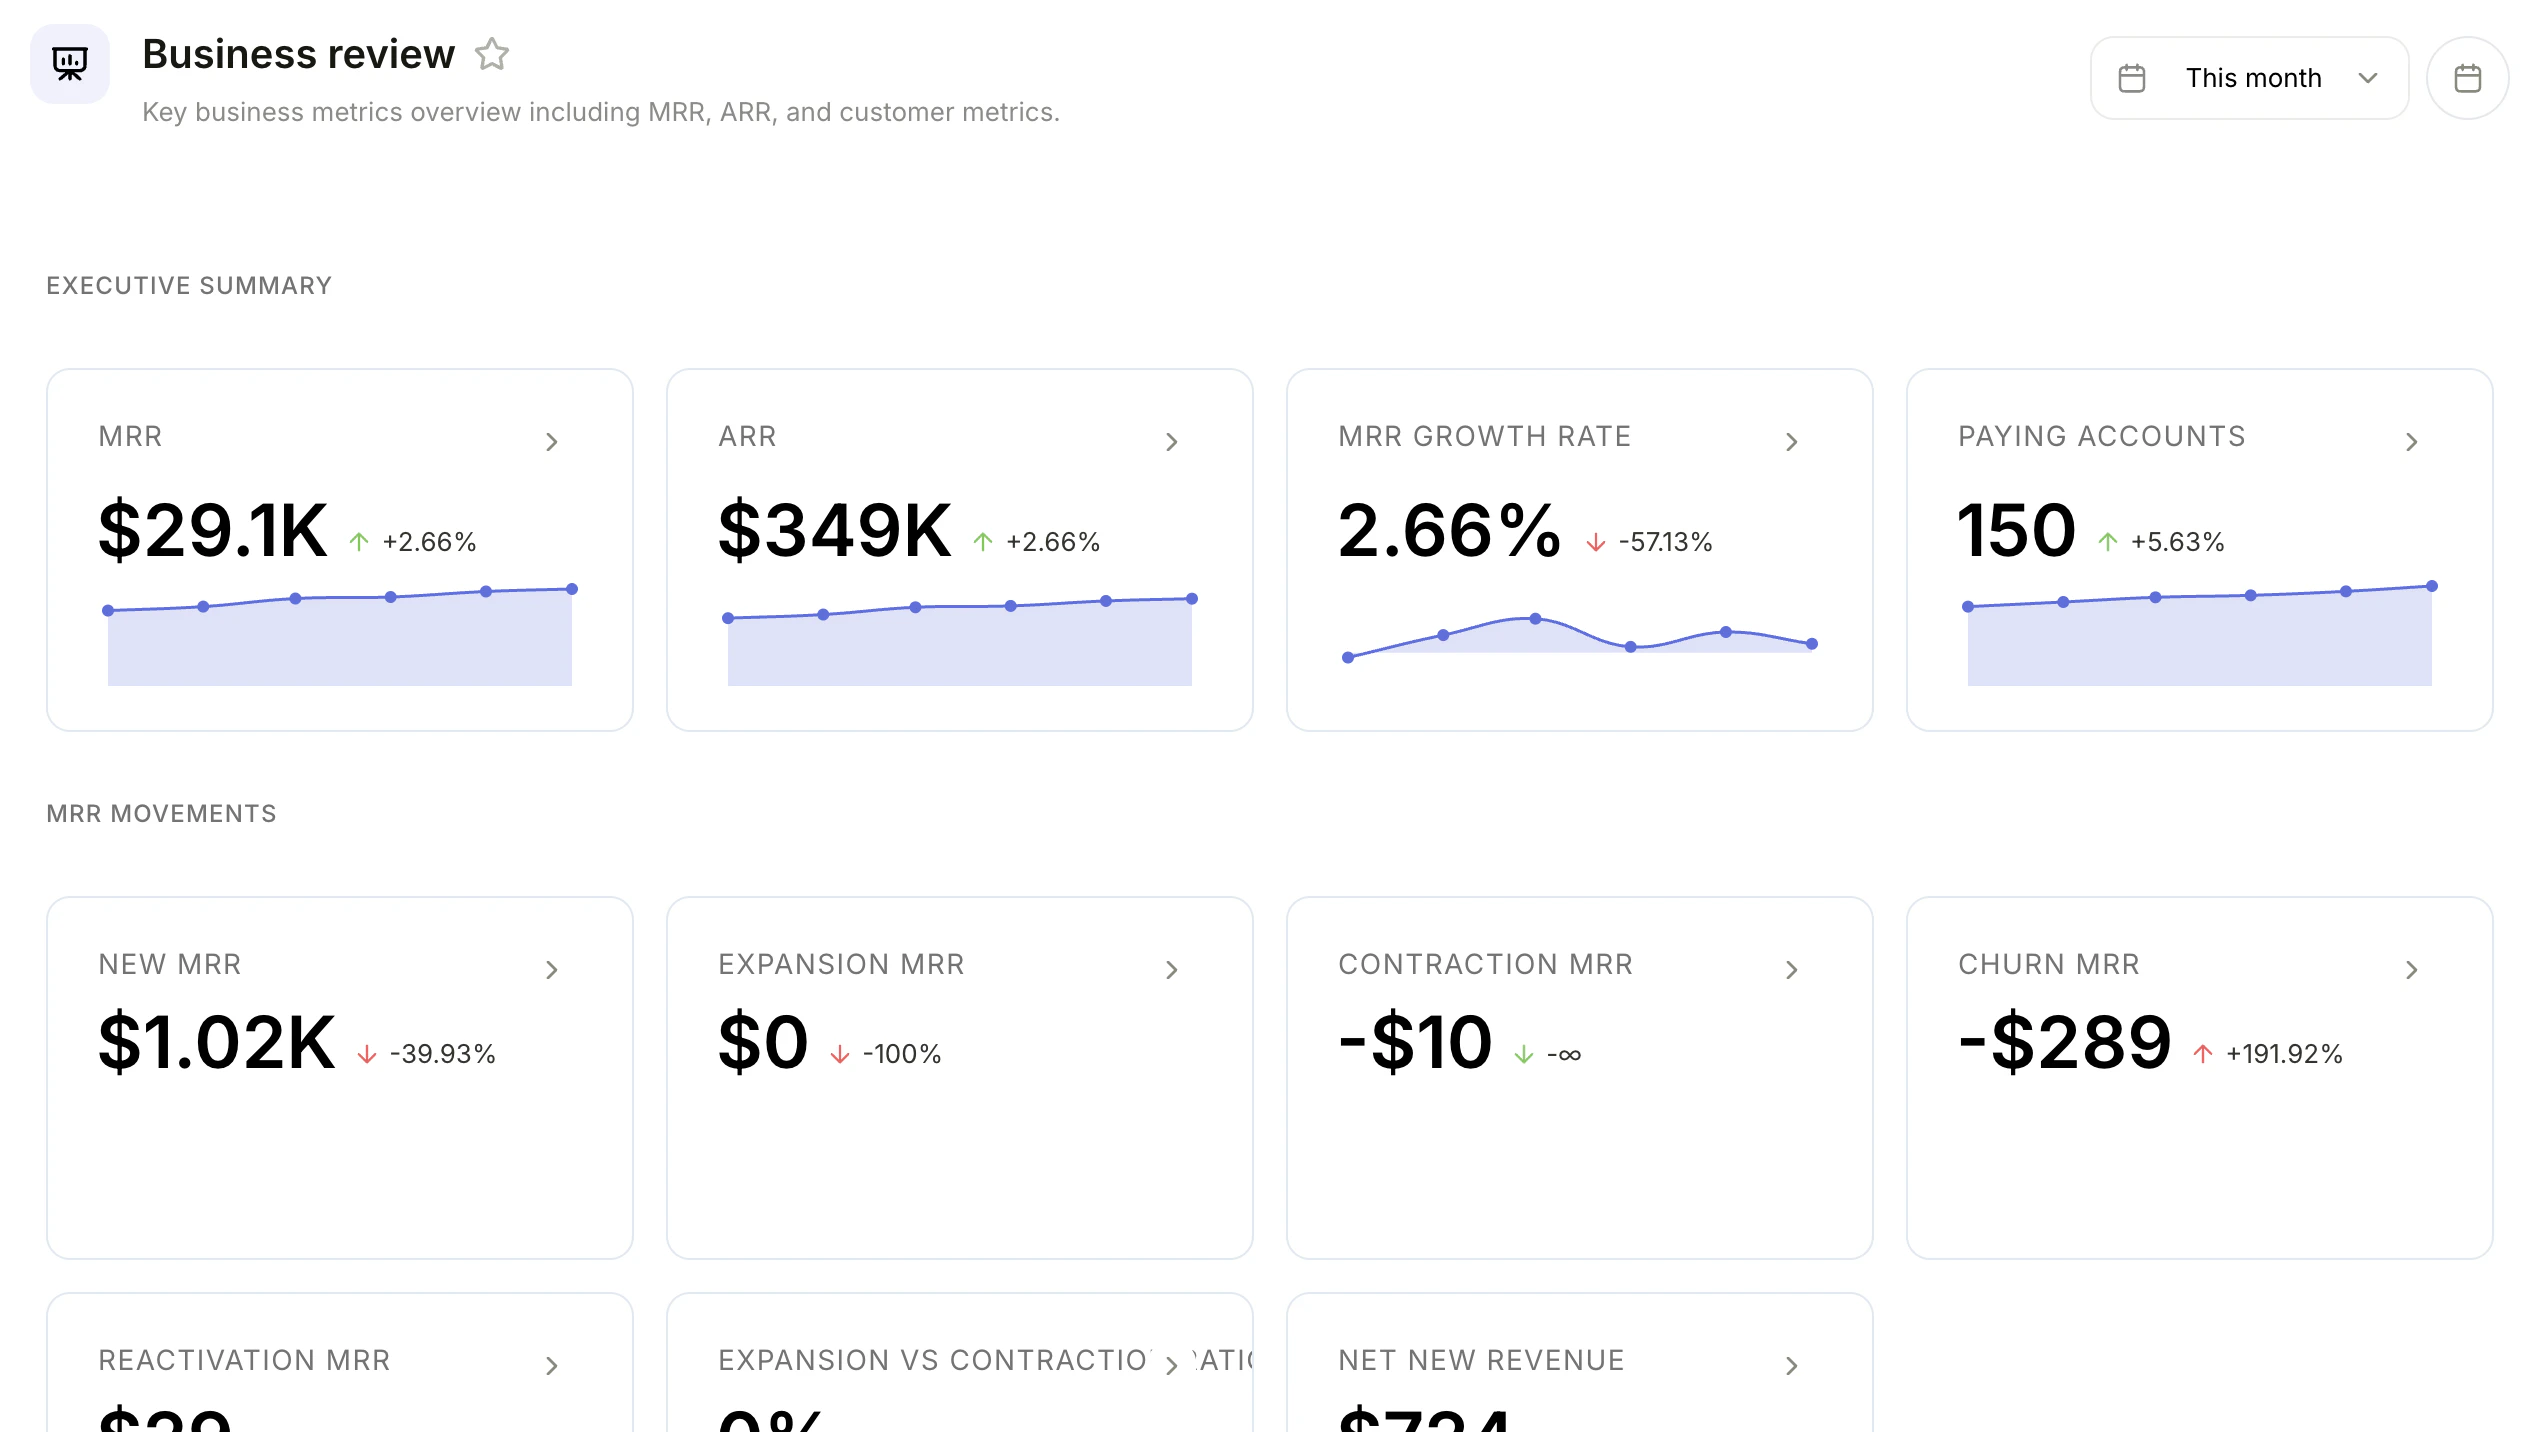
Dashboards are collections of report panels arranged on a single page. Use them to monitor multiple metrics at once and share views with your team. Each panel displays a report, so you can see charts, numbers, and tables side by side.
## Creating a dashboard
1. Go to **Reports** in the navigation
2. Click **New Dashboard**
3. Enter a title and optional description
4. Choose an icon for the dashboard
5. Click **Create**
### Creating from a template
You can also create a dashboard from a template to get started quickly with pre-configured panels. For example, the **Subscription Revenue** template comes with key revenue metrics already set up.
Templates are a great starting point. You can always customize the panels after creating a dashboard from a template.
## Adding reports
1. Open a dashboard
2. Click **Add Report**
3. Choose to create a new report or add an existing one
4. The report appears as a panel on the dashboard
## Arranging panels
Customize your dashboard layout to highlight the metrics that matter most:
* **Drag panels** to reposition them on the dashboard
* **Resize panels** by dragging their edges to make them larger or smaller
* Toggle **Edit mode** to rearrange panels, then switch back to view mode when you are done
Changes to panel layout are saved automatically when you exit edit mode.
## Dashboard time controls
Use the dashboard-level time range and granularity selectors to control all panels at once. Individual reports on the dashboard inherit these settings, so you can quickly switch the entire view between different time periods without editing each report separately.
## What are dashboards?
Dashboards are collections of report panels arranged on a single page. Use them to monitor multiple metrics at once and share views with your team. Each panel displays a report, so you can see charts, numbers, and tables side by side.
## Creating a dashboard
1. Go to **Reports** in the navigation
2. Click **New Dashboard**
3. Enter a title and optional description
4. Choose an icon for the dashboard
5. Click **Create**
### Creating from a template
You can also create a dashboard from a template to get started quickly with pre-configured panels. For example, the **Subscription Revenue** template comes with key revenue metrics already set up.
Templates are a great starting point. You can always customize the panels after creating a dashboard from a template.
## Adding reports
1. Open a dashboard
2. Click **Add Report**
3. Choose to create a new report or add an existing one
4. The report appears as a panel on the dashboard
## Arranging panels
Customize your dashboard layout to highlight the metrics that matter most:
* **Drag panels** to reposition them on the dashboard
* **Resize panels** by dragging their edges to make them larger or smaller
* Toggle **Edit mode** to rearrange panels, then switch back to view mode when you are done
Changes to panel layout are saved automatically when you exit edit mode.
## Dashboard time controls
Use the dashboard-level time range and granularity selectors to control all panels at once. Individual reports on the dashboard inherit these settings, so you can quickly switch the entire view between different time periods without editing each report separately.