
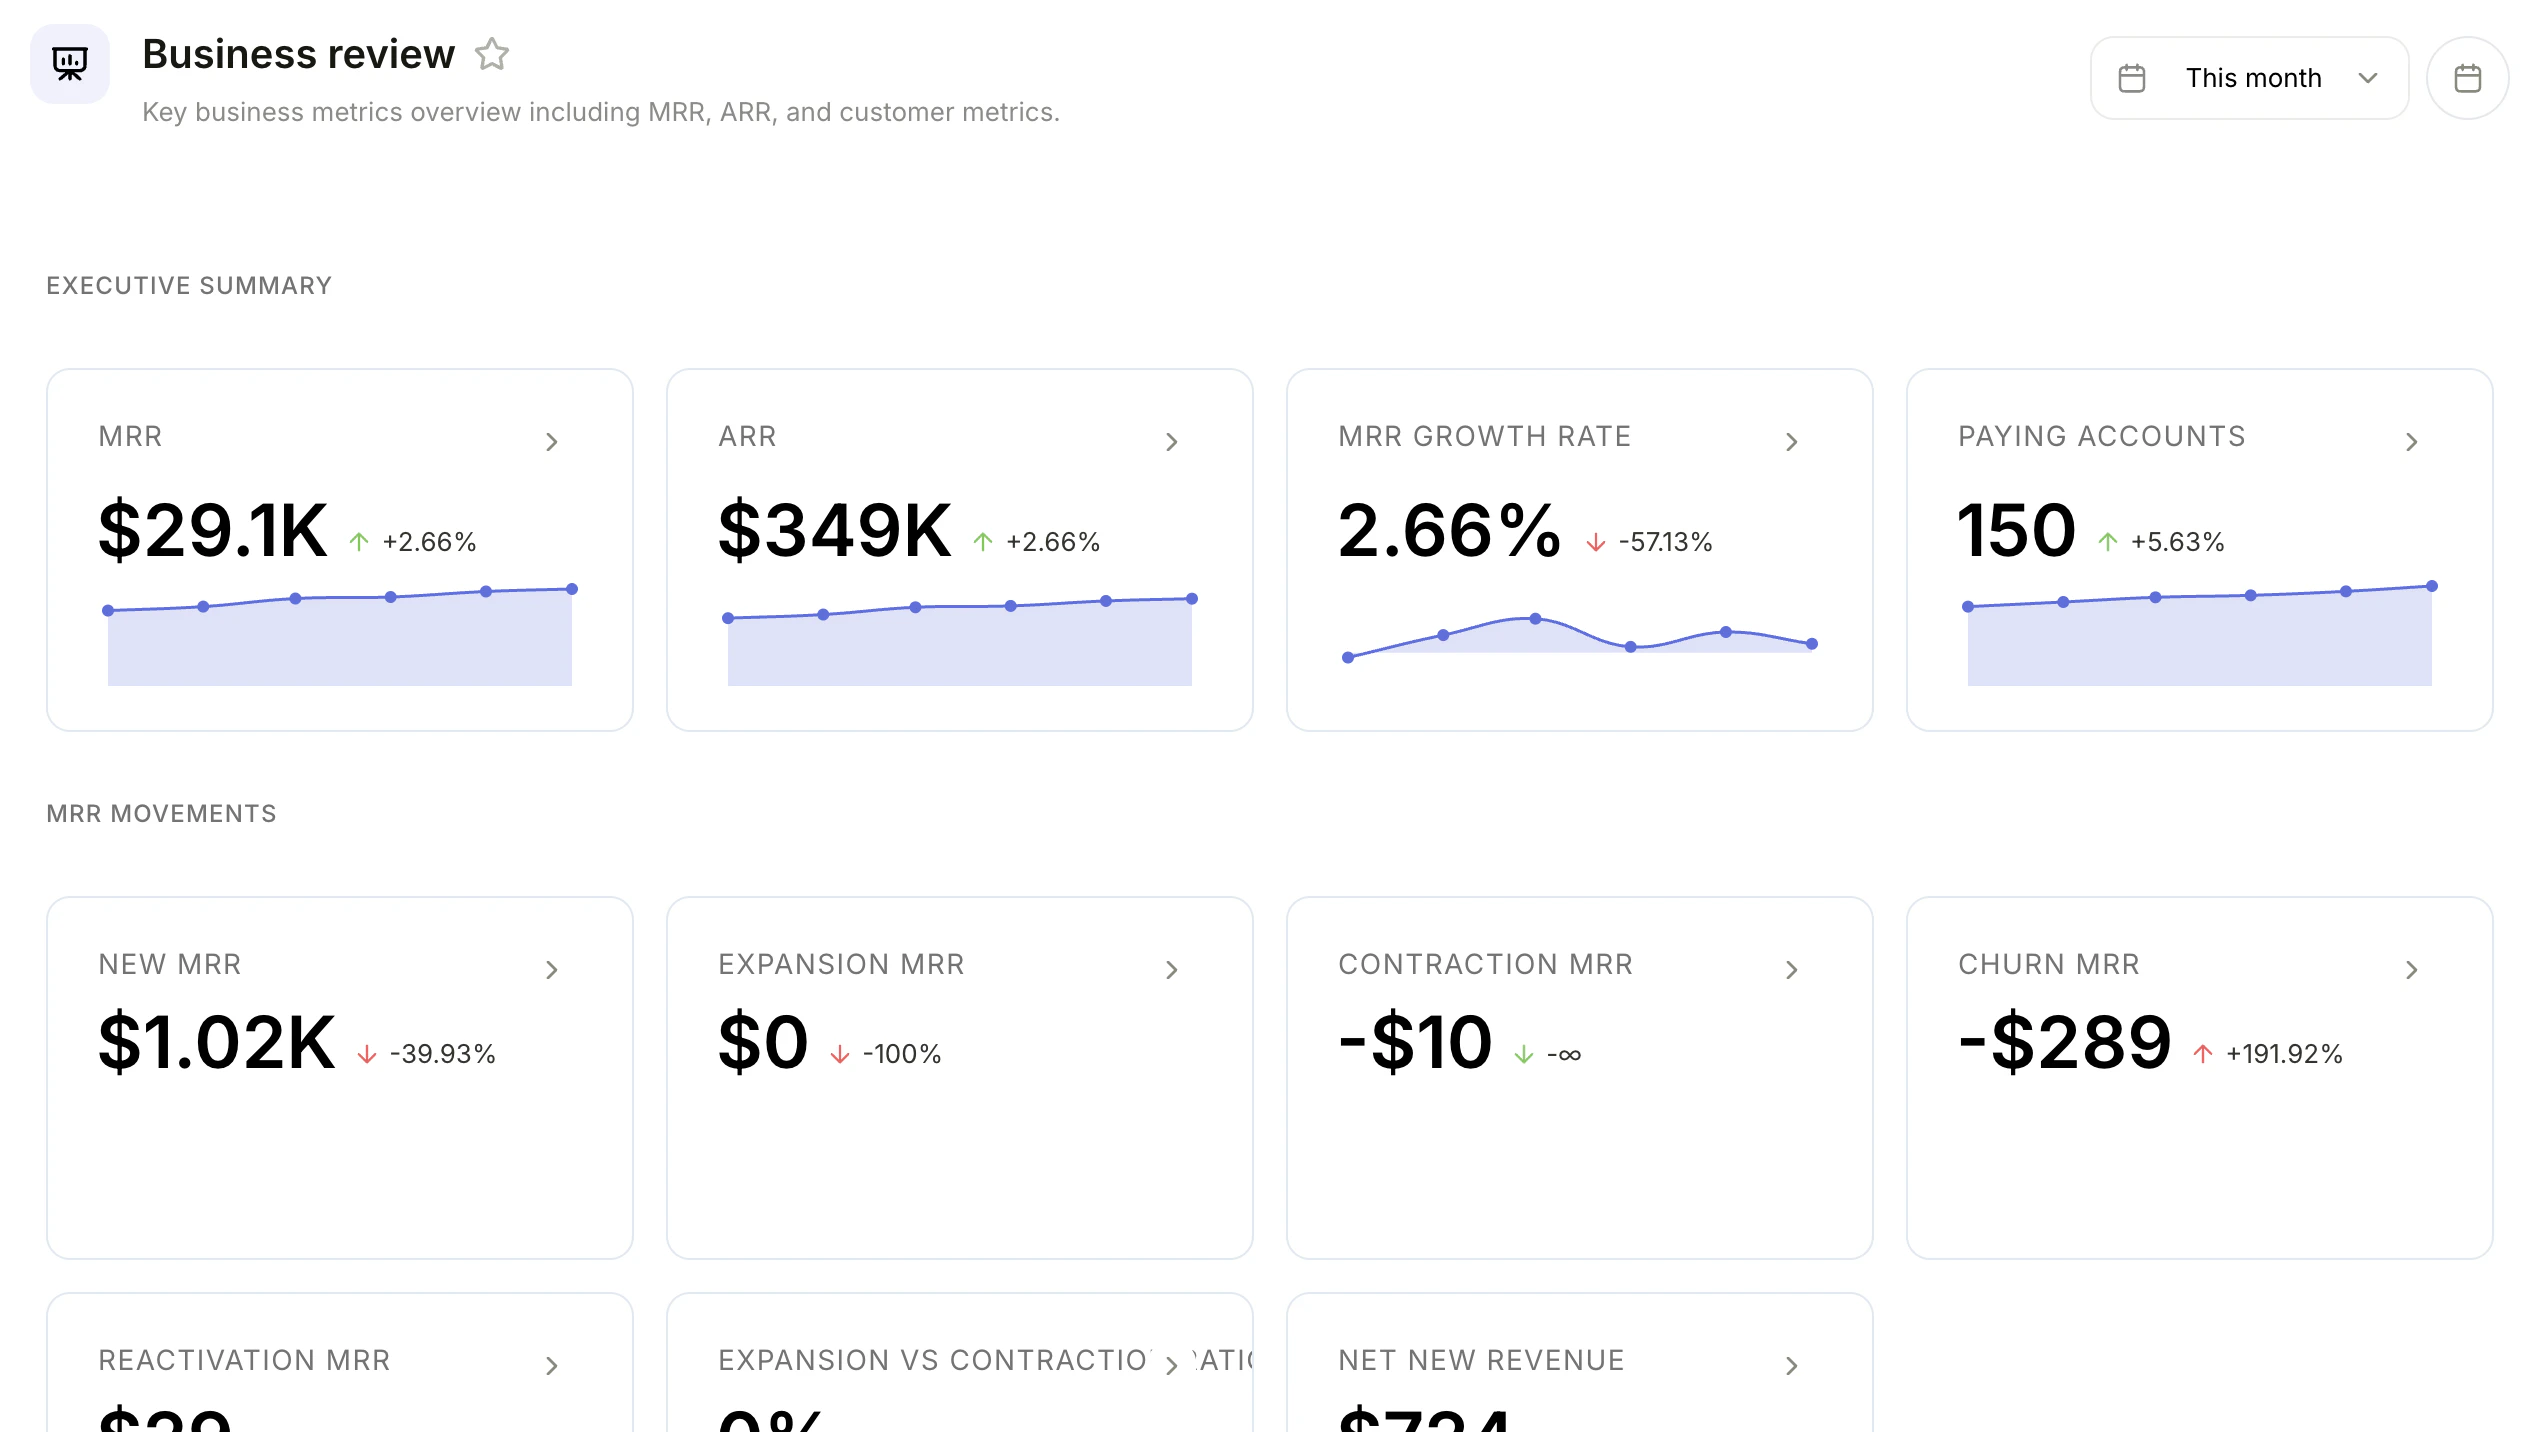
Business review dashboard with executive summary and MRR movements panels
What are dashboards?
Dashboards are collections of report panels arranged on a single page. Use them to monitor multiple metrics at once and share views with your team. Each panel displays a report, so you can see charts, numbers, and tables side by side.Creating a dashboard
- Go to Reports in the navigation
- Click New Dashboard
- Enter a title and optional description
- Choose an icon for the dashboard
- Click Create
Creating from a template
You can also create a dashboard from a template to get started quickly with pre-configured panels. For example, the Subscription Revenue template comes with key revenue metrics already set up.Adding reports
- Open a dashboard
- Click Add Report
- Choose to create a new report or add an existing one
- The report appears as a panel on the dashboard
Arranging panels
Customize your dashboard layout to highlight the metrics that matter most:- Drag panels to reposition them on the dashboard
- Resize panels by dragging their edges to make them larger or smaller
- Toggle Edit mode to rearrange panels, then switch back to view mode when you are done
Changes to panel layout are saved automatically when you exit edit mode.